Waveform
Use this control to easily draw a curve or broken line waveform.
How to use
First create a waveform control in the UI file, which specifies the drawing area of the waveform, and then add a Wave control to the area just created, you should be able to see it immediately A rough preview of the waveform. The specific creation process is as follows:
You can add multiple waveforms to the waveform graph and adjust their appearance.
Note:Since we cannot directly select a single waveform control on the preview image, when we need to adjust the specified waveform properties, we need to select on the outline view.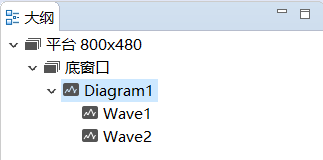
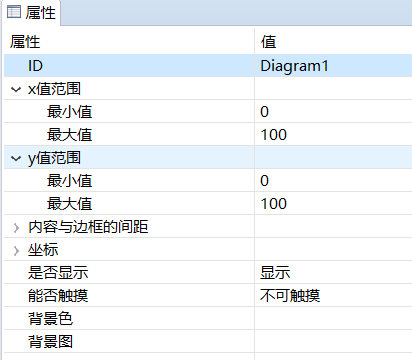
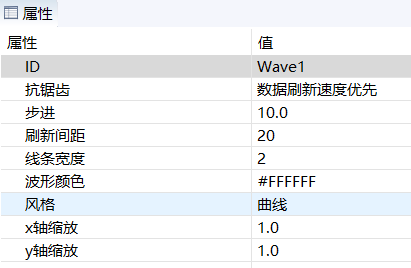
Check the properties of the Wavrform and Waveform controls respectively, you can find that Waveform graph determines the value range of the x-axis and y-axis of the waveform, and the drawing area of the waveform. The Waveform determines the appearance style of each waveform.
Among them, the two properties of
stepandrefresh intervalin the properties of Waveform need to be explained.- step
It represents the value of the advance of the waveform image every time you add a piece of data to the waveform. This value will be affected by the x-axis zoom property.
- step
- Refresh interval
Indicates the width of the Vacant part when the waveform is refreshed
The above two properties are only valid when the waveform data is added using the void addData(int index, float data) function.
Coordinate axis and zoom
The image scaling of the entire waveform is done automatically, we don't need to care about it, we only need to determine the x-axis range, y-axis range, and the rectangular display area of the entire waveform image in the attribute table.
Note: The x-axis zoom and y-axis zoom properties in the waveform control will multiply the business value you added by the ratio and then draw it on the screen. The default is 1.0, which means no zoom.
The coordinate axis of the waveform is determined by x-axis minimum, x-axis maximum, y-axis minimum, and y-axis maximum
For example, the default x-axis range is [0, 100], y-axis range is [0,100], then the coordinate axis they form is

Generally, the value of the x-axis minimum value attribute input is less than the value of the x-axis maximum value attribute input. But if the input minimum value and maximum value are reversed, the waveform image drawn with the same data will be reversed;
If you use thevoid setData(int index, const MPPOINT *pPoints, int count)function to add waveform data, the refresh direction will be reversed. Similarly, for the y-axis, drawing a waveform image will cause upside down.
Code operation
Similarly, the UI file only helps us quickly modify the appearance of the waveform, and the specific waveform data must be added through code.
In the public function of the project's jni/include/control/ZKDiagram.h file, you can see all the supported operations.
Note: Unlike other controls, the Wave control we added has ID attribute, but it does not generate independent pointer variables. Only the Wave Graph control that contains Wave will generate pointer variables. Therefore, to operate a certain waveform, you need to use the Waveform graph pointer, and then use the index value to indicate which Waveform is operated.
The value of index starts from 0.
void setPenWidth(int index, int width)
Set the wavy line width, corresponding to the line width property on the property sheetvoid setPenColor(int index, ARGB color)
Set the waveform color, corresponding to the wave color property on the property sheetvoid setXScale(int index, double xScale)
Set the x-axis zoom, corresponding to the x-axis zoom property on the property sheet,void setYScale(int index, double yScale)
Set the y-axis zoom, corresponding to the y-axis zoom property on the property sheetvoid setData(int index, const MPPOINT *pPoints, int count)
Thetypedef struct _MPPOINT { float x; float y; }MPPOINT;MMPOINTstructure contains the x and y values of a single data. The function means to plot thecountpoints in thepPointsarray onto theindexth waveform. Note: Thecountvalue cannot be greater than the actual size of thepPointsarray, otherwise the array will be out of bounds.
The idea of using this function to draw a waveform is: First, fill the data to be displayed into thesPointsarray, and then draw the points in the array on the waveform at one time. Therefore, if you want to achieve the animation effect of the waveform moving to the left or right, you need to manually offset the value in the array by a subscript as a whole, and then display it on the waveform, and then shift it by a subscript as a whole, and then Displayed on the waveform, and so on. Usually such a loop is implemented through a timer.
So this method will cause the entire waveform image will be refreshed。void addData(int index, float data)Add a single data to the waveform,databis the y value, you may wonder why there is no x value, because this function number is local waveform graph refresh, when you call this function to set the y value every time, The system will automatically offset a certain x value, and the size of this offset is the same as the set step property.
Comparingvoid setData(int index, const MPPOINT *pPoints, int count)andvoid addData(int index, float data)two ways to refresh the waveform, it can be concluded that if the amount of data is large, the second This method will have higher refresh efficiency.void clear(int index)to clear the waveform data
Add the method of wave movement
As mentioned above, if you use the void setData(int index, const MPPOINT *pPoints, int count)method to draw waveforms, you usually need to offset the values in the array by yourself.
static void movePoints(MPPOINT* p,int size){
    for(int i =0;i < size-1;i++){
        p[i].y = p[i+1].y;
    }
    p[size-1].y = 0;
}
Add timer to refresh waveform data regularly
Under normal circumstances, add a timer to match the waveform to facilitate regular refresh
Sample code
Effect picture
For the specific use of waveform control, please refer to the DiagramDemo project inSample Code.
