View log
Add log
- Required header files
#include "utils/Log.h"LOGDorLOGEmacro output, and the usage method is the same as that of C languageprintf; there are examples (commented out by default, open when needed) of calling in the code generated by default:
```c++
static bool onButtonClick_Button1(ZKButton *pButton) {
    LOGD("onButtonClick_Button1\n");
    return true;
}
```
View print log
View via command line (recommended)
- Find the top menu of the software, and then open the menu
Debug configuration->Open system command line - If you use a USB cable to connect to the device, directly enter
adb shell logcat -v timein the command line and then enter the Enter key. If the computer is connected to the device normally, you will see all the log information of the device.
If you are using a network connection, such as WIFI, Ethernet, you have to check the device first, get the device's IP address, and then enteradb connect 192.168.1.123in the command line (change the IP address yourself), and then Enter the Enter key, if the IP is correct and the connection is normal, you will see this message:connected to 192.168.1.123:5555,
After the normal connection, enteradb shell logcat -v timeand enter the Enter key to see all the log information. - You can use the
Ctrl + Ckey combination to stop the log display.
View in UI interface (deprecated)
After connecting ADB , you can view the print log of the program through our tool. The specific steps are as follows:
On the menu bar, select
Debug Configuration->Switch Log Window, the tool will switch to another interface.
在In the lower left corner of the new interface, select LogCat, if the connection is normal, in the red box area on the right, you will see the machine's print log.

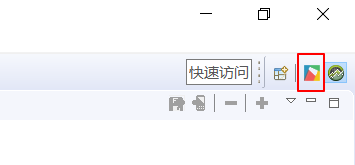
If you want to return to the code editing interface, click the FlyThings icon in the upper right corner of the tool.
